Real-time US Election Results Map
Interactive real-time map embedded on a major news website, handling millions of users on election night.
Product in one sentence
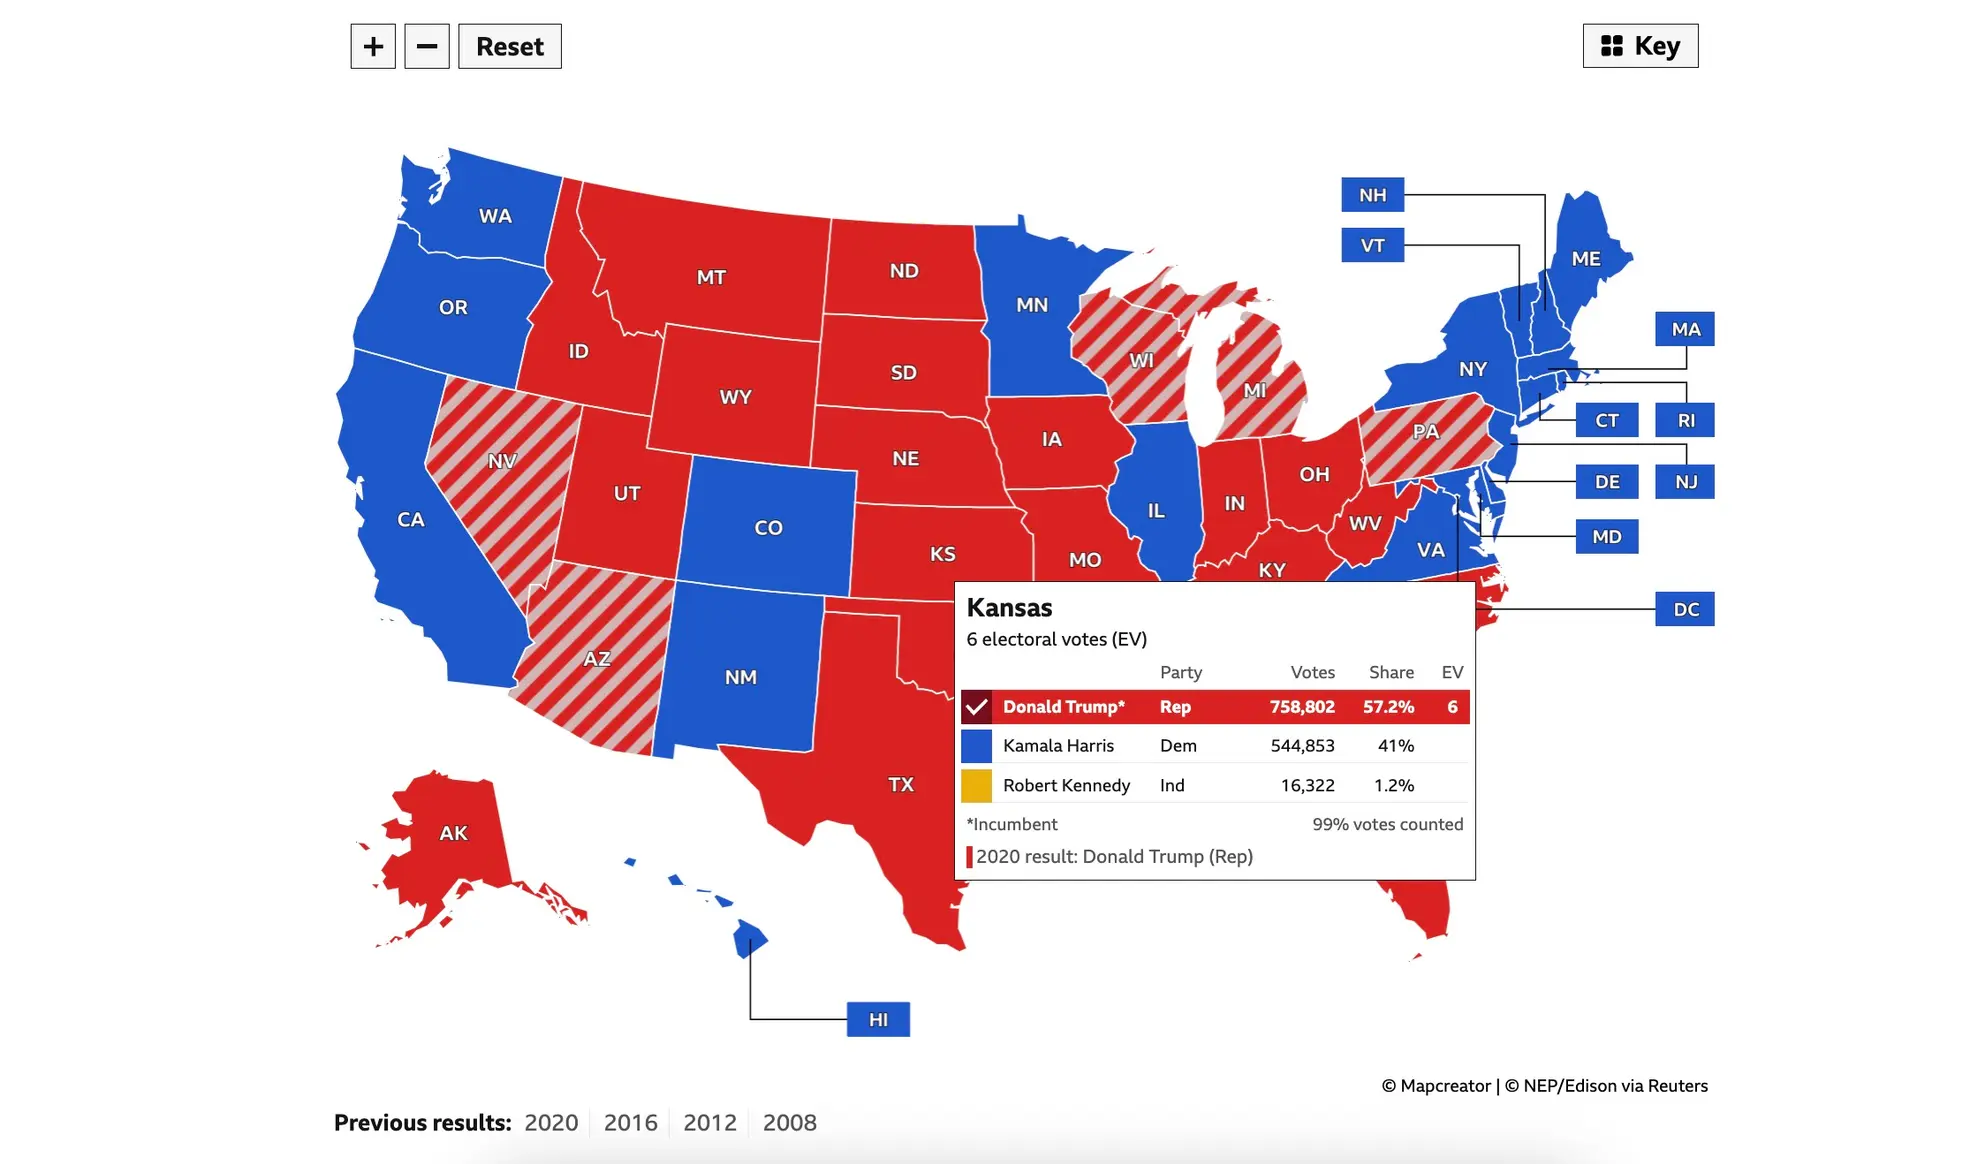
A real-time, county-level election results map embedded on a major news site, delivering smooth interactions to millions of users on election night using Vue 3, MapLibre GL, and a robust Node.js data pipeline.
My role
Led the frontend implementation and real-time data integration. My responsibility was turning normalized election data into a smooth, performant interactive map that remained responsive under peak traffic—millions of users zooming, panning, and clicking simultaneously on election night.
What I did
- •Architected Vue 3 + Vite frontend with MapLibre GL, rendering custom vector tiles prepared specifically for the election. Implemented dynamic coloring by leading candidate/party and adjusted color intensity based on reporting percentage.
- •Implemented a polling and diffing layer that checked for new data every ~30 seconds, comparing payloads with current state and only re-rendering changed geographic areas. Smoothed transitions so the map gently settled into new results instead of jumping.
- •Optimized for scale: split code so heavy map logic loaded on demand, tuned MapLibre GL settings (tile cache, zoom levels, label density), and kept the Vue component tree shallow around the map to reduce reactivity overhead.
- •Built responsive hover and click interactions with context menus as regular Vue components. Created a single embed script the newsroom could drop into their election pages without additional setup.
- •Collaborated on data pipeline: Node.js Lambda consumed official election feeds, normalized into internal schema, generated compact tile-friendly format, uploaded to S3 fronted by CDN. Added a small WebSocket app for internal team monitoring during the night.
- •Engineered robust state management: Postgres stored slower-moving and historical data, Redis acted as cache and coordination layer to prevent overlapping Lambda runs from fighting over files.
Impact & Results
Kept the map responsive under election-night traffic.
The embed stayed smooth and clickable on the homepage during peak election-night traffic, updating results every ~30 seconds without page reloads or visible lag.
Helped readers make sense of county-level results quickly.
Users could jump from national overview to individual counties in one click, seeing leading candidate, margin, and reporting progress without waiting for slow refetches.
Reduced bundle size and improved loading on slower connections.
Used Vite, code splitting, lazy loading of map features, and CDN-backed tiles so the widget loaded quickly even on mid-range devices and 4G networks.
Made the widget easy to embed and operate.
Delivered the map as a single script + container element, tested across modern browsers and devices, and exposed a small config API so the newsroom could reuse it on multiple election pages.
Next Project
SaaS & Portals
Telehealth Patient Portal Modernization